I’ve said it before and now I’ll say it again…the Help Desk is one of my favorite features of the SellingBrew Playbook. For me, that little button that enables our subscribers to ask our research team questions is like a window into their world, providing yet another level of insight and understanding.
And oh boy, do we get to field some great questions!
For example, we recently received this question from an ambitious sales analytics lead who wants to identify “whitespace” sales opportunities in existing customer accounts:
How can we see the customer spend we aren’t getting?
It certainly seems like a vexing question, doesn’t it? How in the world can you see something that isn’t there? How can you see what your customers are buying from your competitors instead of you? Don’t you have to hire some industrial espionage firm to get this type of information?
While you can’t see exactly what a customer is buying elsewhere, you can get a very good idea by comparing them to similar customers and looking for meaningful gaps in spending patterns.
Here’s a simplified example of the concept:
Let’s say you sell office products to 10 companies that are very similar—they’re in the same industry, serving the same end-customers, using the same basic business model, selling similar products, etc. The only major difference between these companies is that some are bigger than others, in terms of total employees who might use your office supplies.
Given their other similarities, you could reasonably assume that these companies would have similar office product needs, right? Right! And these needs would probably be in proportion to their size, right? Right!
Looking across all ten customers, you’d be able to establish what’s “expected” for this type of buyer. You’d be able to determine how many different categories of office products they’d typically buy, and in what proportions or ratios.
And by comparing each individual customer in the group to the expected buying pattern of the group, you’d be able to clearly see what you’re missing, in terms of both product spread and volume.
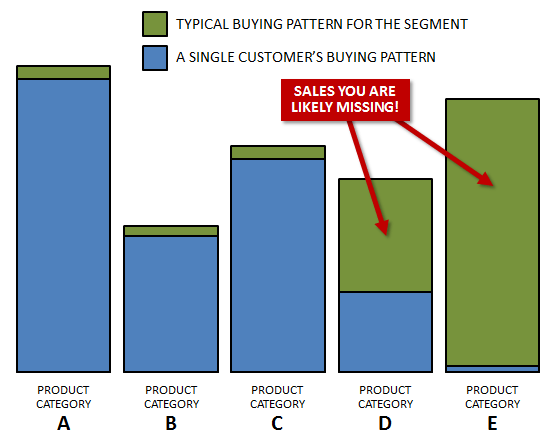
The underlying analytical concept is relatively straightforward and fairly easy to understand. In essence, you’re using the buying patterns of your best customers to help you identify what similar customers are likely sourcing from someone else.
But I have to point out that while it may be possible to do this type of segmentation and analysis manually, it’s simply not very practical—particularly if you have a lot of different customers and a broad range of products. And that’s why more and more B2B companies are leveraging technologies that can perform this type of “whitespace” analysis at level of scale, speed, and accuracy that manual processes can’t even come close to replicating.
You can tell a lot about people by the questions they ask. And this question tells me that this particular sales analytics lead takes the “lead” part of their title very seriously!
Conducting Whitespace Analytics
What if there was a way to analyze all of your customers at once, identify the whitespace opportunities, and serve them up to the sales team on a platter? Learn the seven step process for doing just that.
Predictive Sales Analytics
Predictive sales analytics has proven to be a powerful tool for improving effectiveness and boosting results at-scale. In this on-demand webinar, we demystify the core concepts and applications in sales environments.