During the last few months, we’ve all had to change our approach to planning. It’s no longer possible to make definite plans about when or where you might be getting married or who might attend. Plans for big events like graduations, anniversary parties, baby showers, and funerals are often changing right up until the last minute before they occur. Even making an appointment at the dentist or the hair salon comes with a high degree of uncertainty about whether it will actually take place. Heck, you might not even be sure from day to day whether you are going to go to work or not.
During this time of dramatic unpredictability, it’s more important than ever for organizations to have true sales intelligence.
In the past, some organizations might have been able to make do with basic sales analysis. They could look at their past financial data, and because the markets were relatively stable, they could use those historical numbers to make some pretty good forecasts about what might happen in the future.
But in a world where almost nothing is certain, looking at your own sales data is not enough.
A lot of sales analysis teams are realizing that they need to implement some sales intelligence techniques and examine the broader economy, as well as their own tiny slice of the market. They are coming to understand that getting a little distance from their own data gives them greater predictive power.
What do we mean when we talk about getting some distance from your own data? We like the use the chart below to illustrate the different kinds of signals that you can use for sales intelligence. Your own sales data, right there at the center of the chart, tells you a lot about what is happening right now. This data provides a lot of certainty — it’s what is actually happening — but it doesn’t have as much predictive value, especially in an environment where almost everything is in flux.
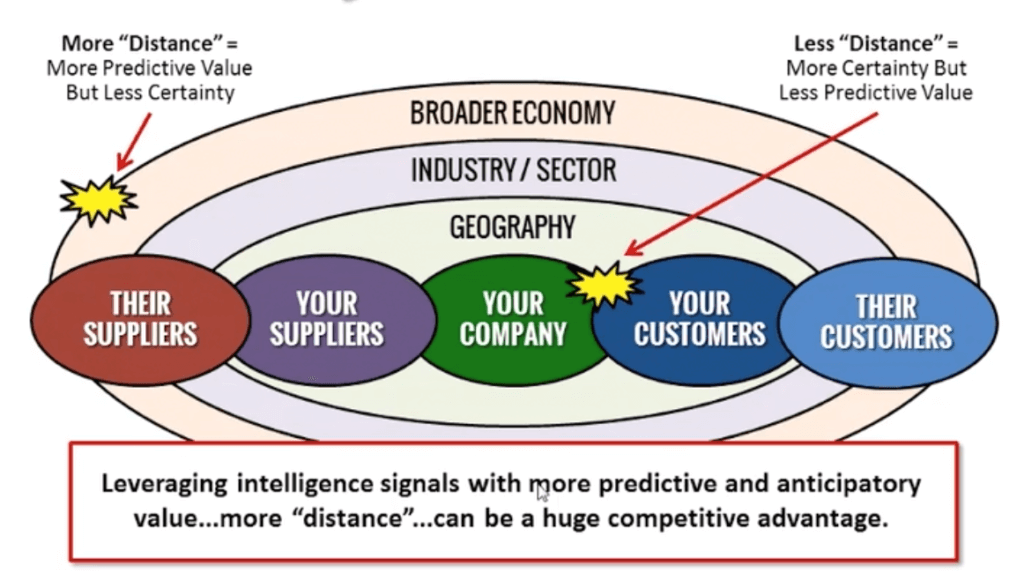
By contrast, if you are analyzing signals that originate closer to the edge of the chart, you will get less accuracy but more predictive value. For example, looking at your customers’ customers’ current sales data might give you an idea of what your customers’ orders might look like in a couple of weeks or months. Or looking at what has happened to your industry in other regions of the world that began experiencing the coronavirus before your area did might tell you something about what you can expect to see when your region reaches a similar point in the pandemic. And while it’s a little far afield from our usual recommendations, you might even want to stay on top of emerging scientific research into treatments and vaccines that could have a tremendous impact on the economy in the coming months and years.
As the chart highlights, focusing on what is happening within your company helps you understand what has happened or just recently happened, but it doesn’t provide much insight into what will happen in a few weeks or months. But focusing on signals from other places that will eventually affect your company could give you a competitive advantage. If you can see something coming that your competitors don’t see — you have a time to prepare for it — and better yet, take advantage of it.
To get a better idea of what sales intelligence is and isn’t, as well as tips on how to implement it at your organization, check out the webinar on The Fundamentals of Sales Intelligence. Putting a program like this in place won’t suddenly make the pandemic economy predictable, but it can help you prepare for the shifts and changes heading your way.


